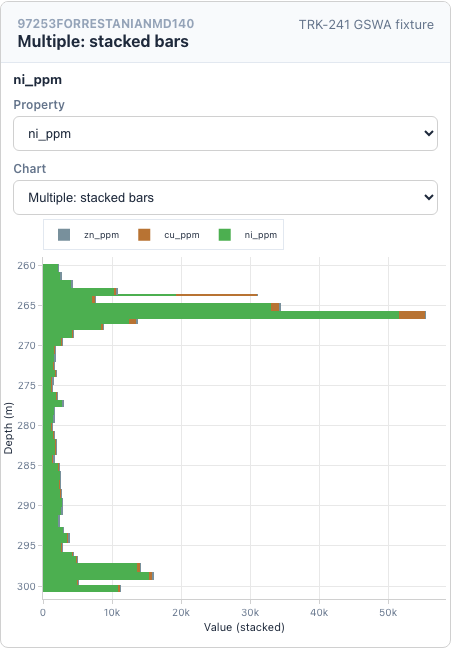
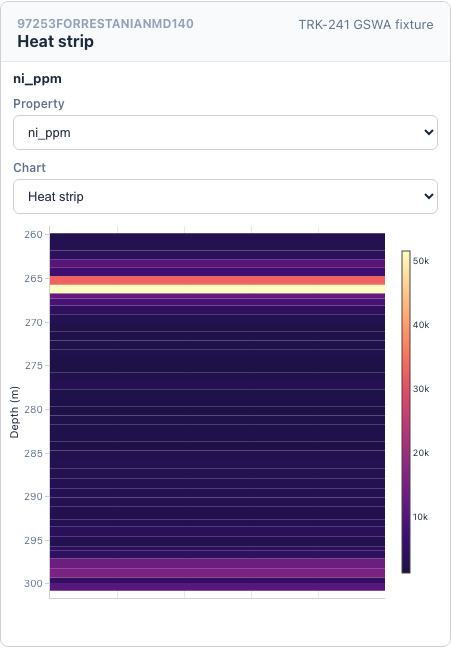
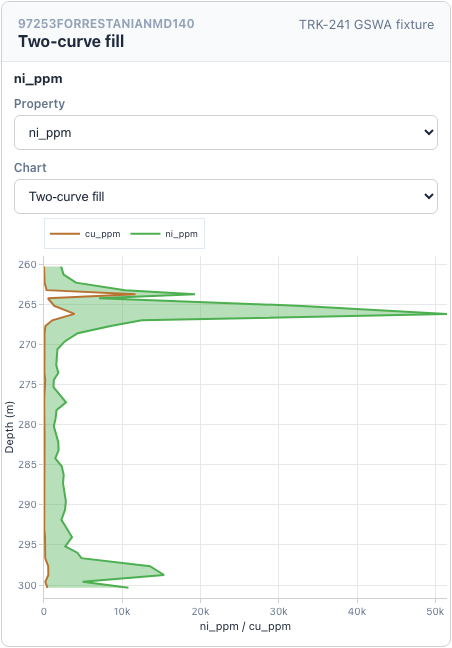
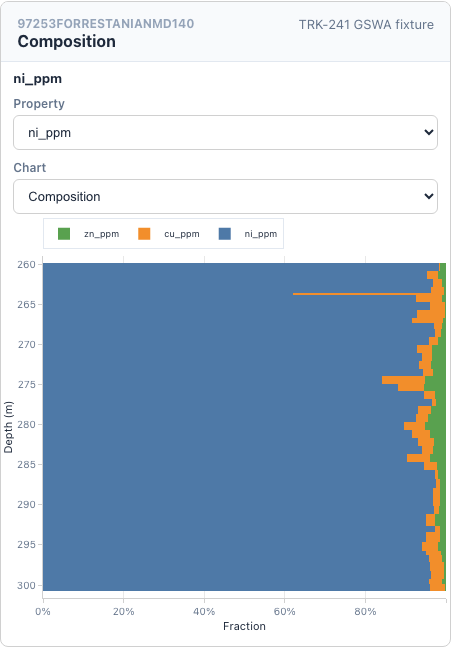
This catalogue renders the production JavaScript wrappers against the same TRK-241 GSWA examples used by the visual-regression suite. Standard TracePlot coverage includes numeric, categorical, comment, and structural tracks. BaselodeStripLogToolUI coverage includes the numeric and categorical families it currently supports. Each image is a committed baseline, so changes to wrapper controls, geometry, colour, labels, spacing, or rendering are visible during review.
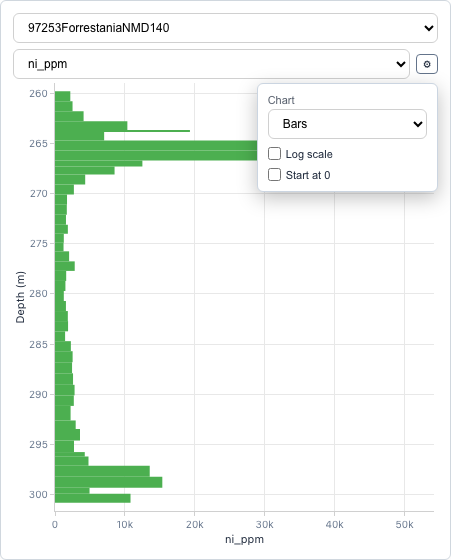
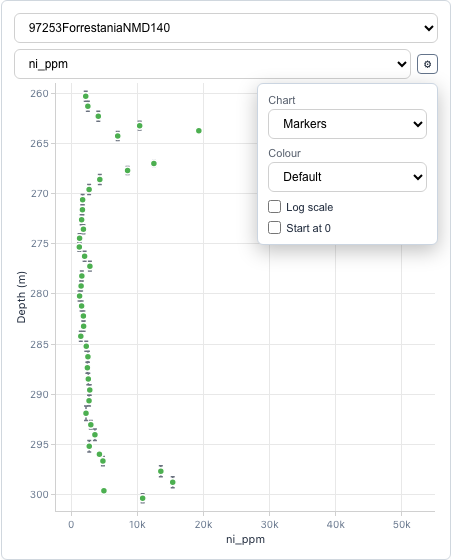
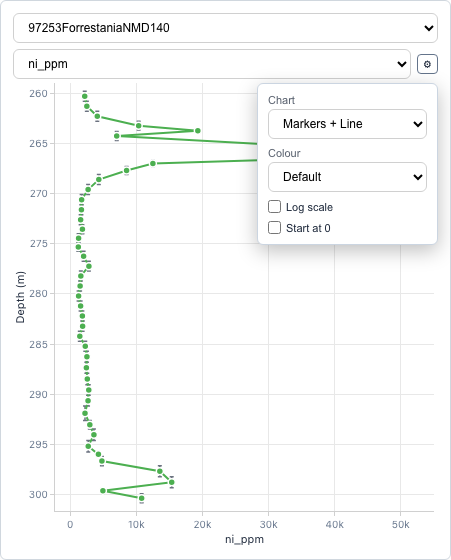
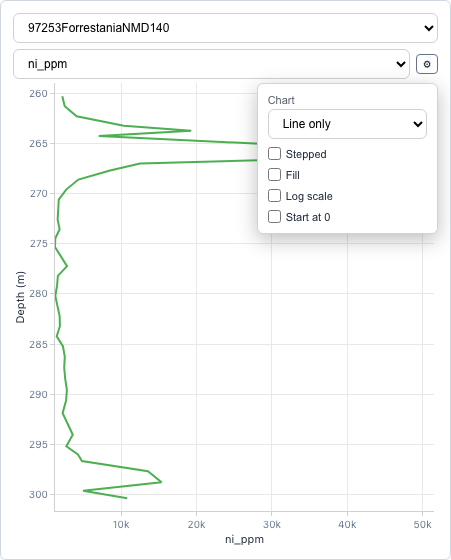
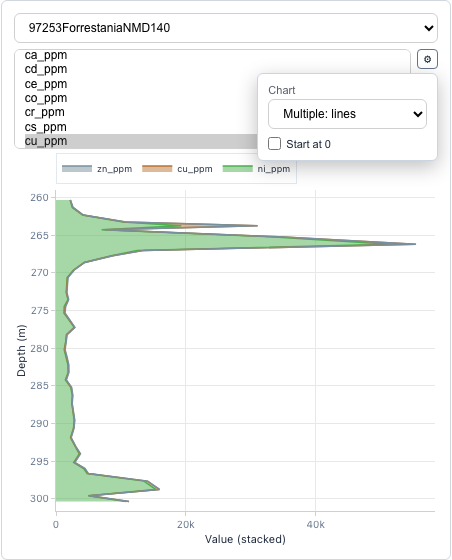
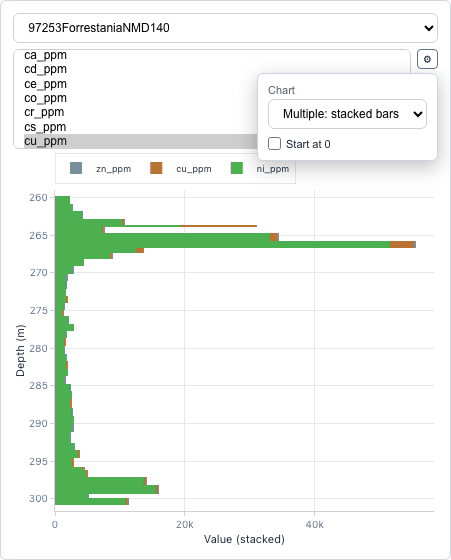
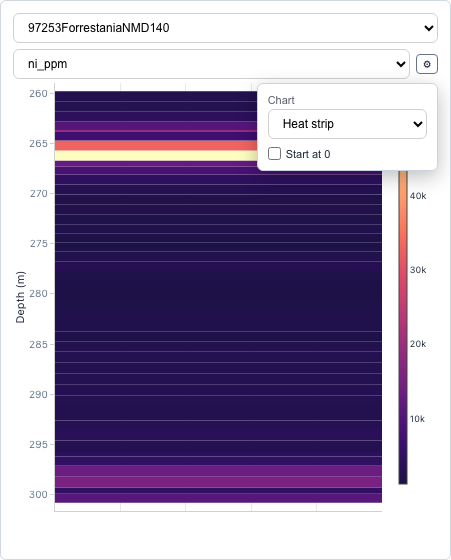
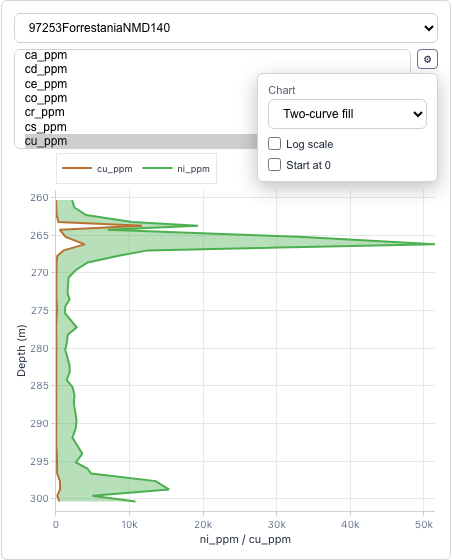
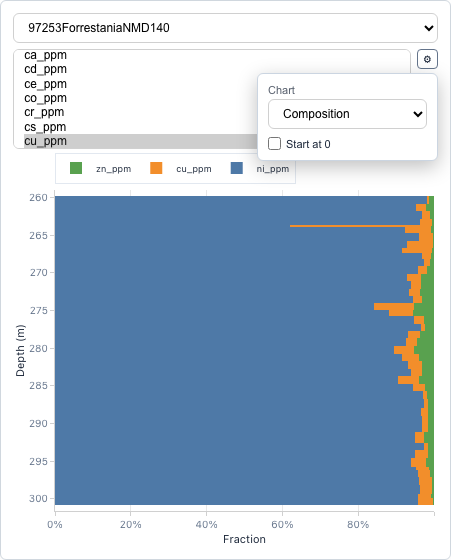
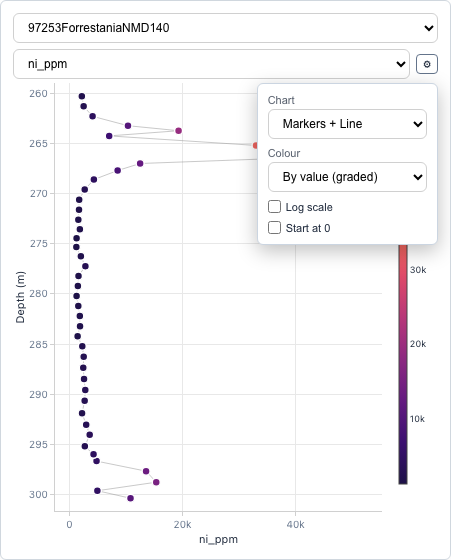
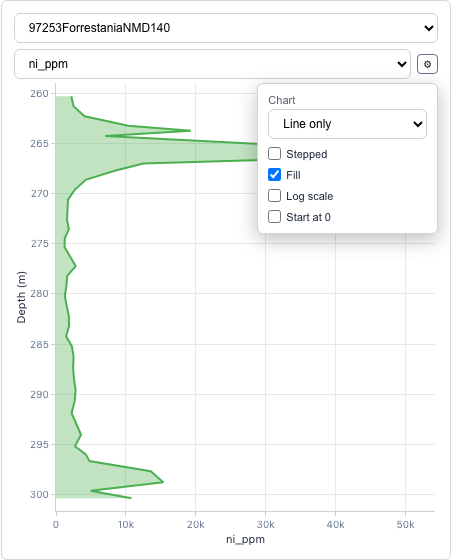
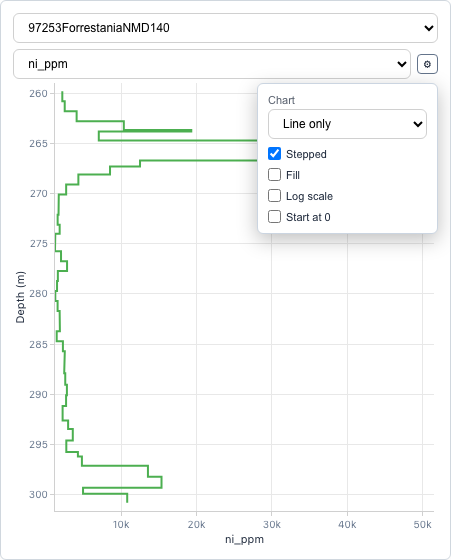
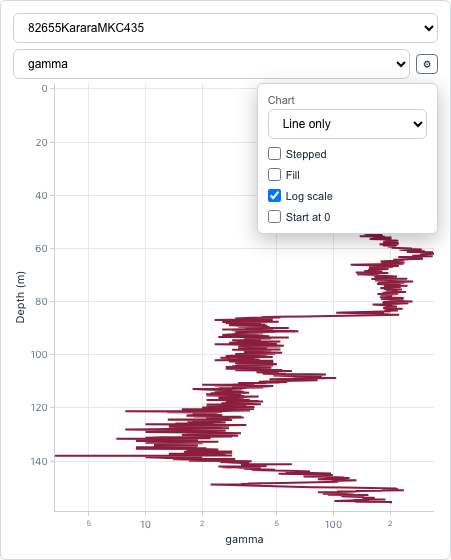
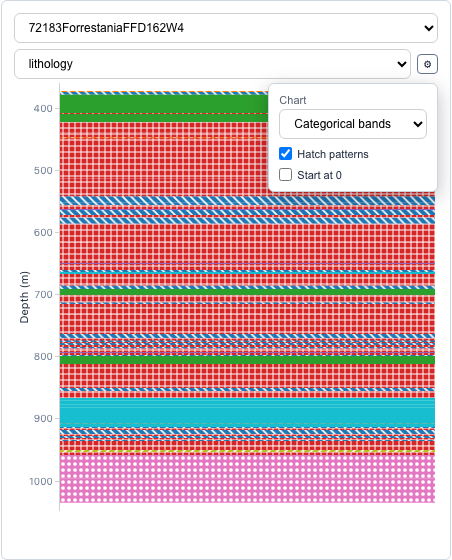
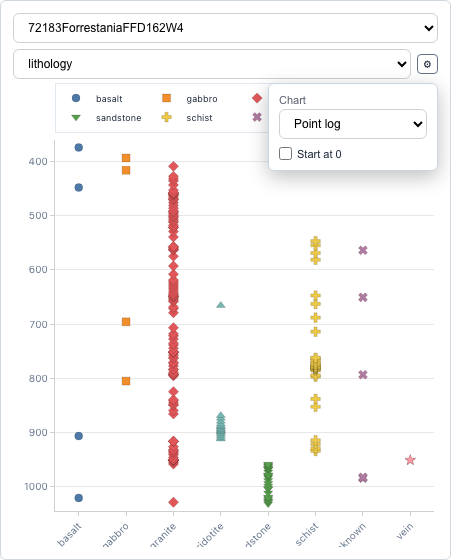
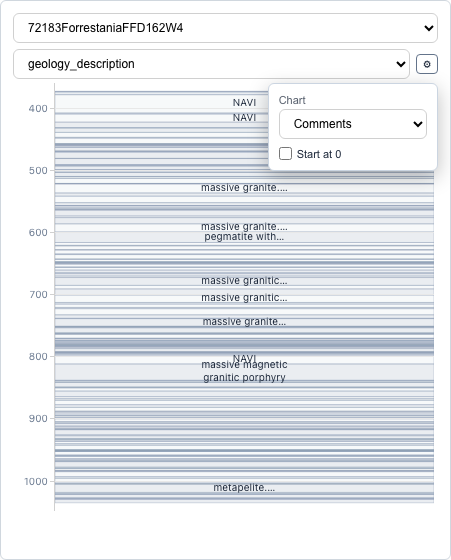
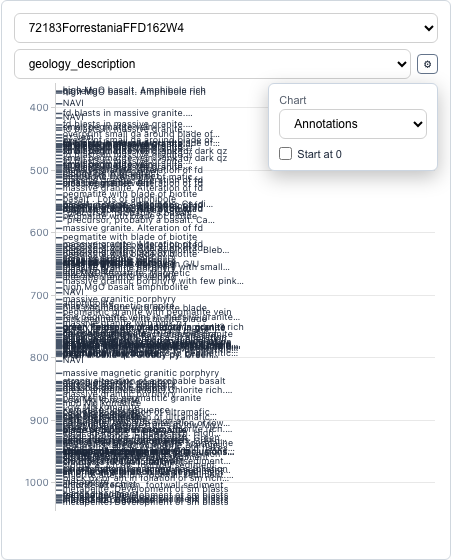
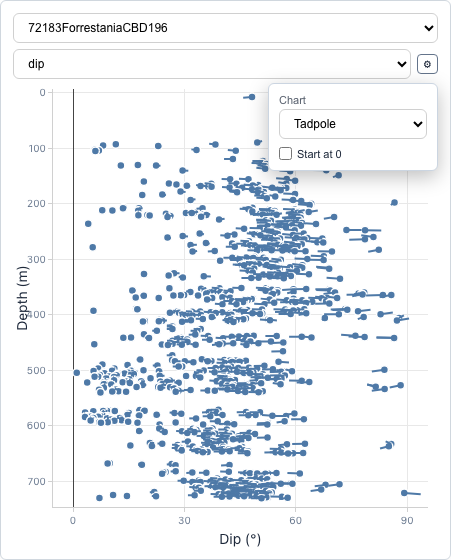
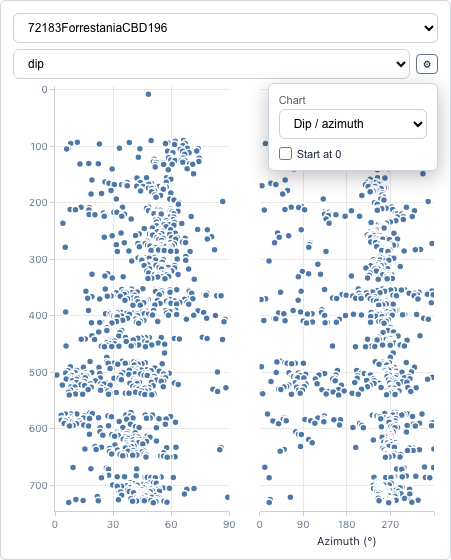
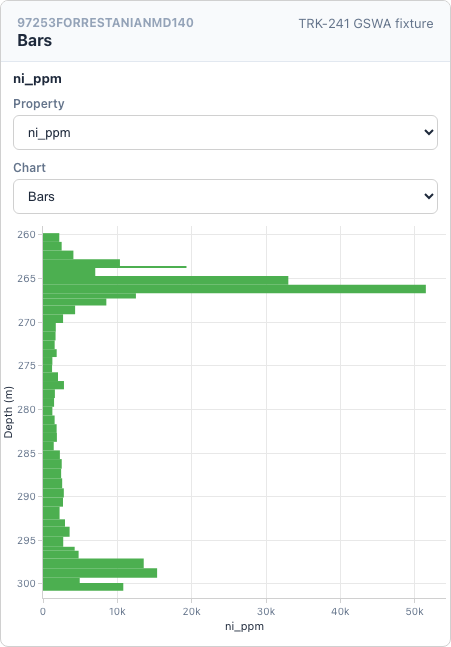
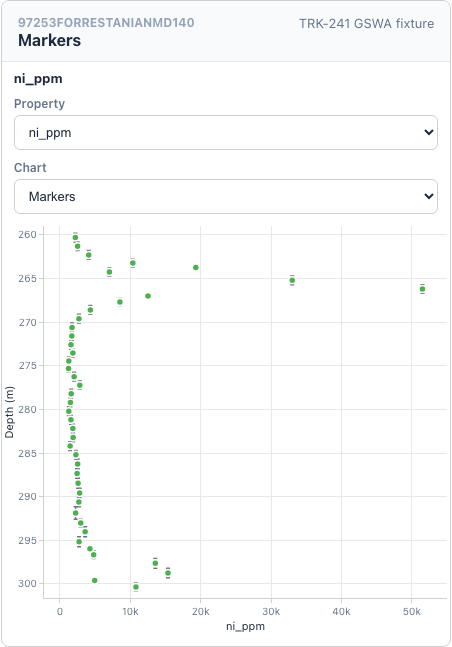
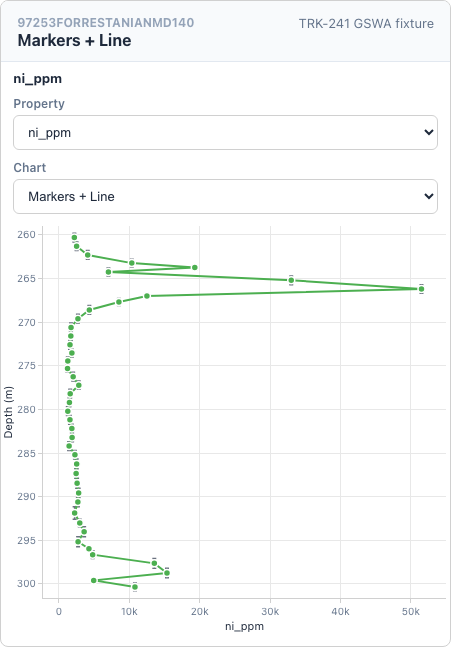
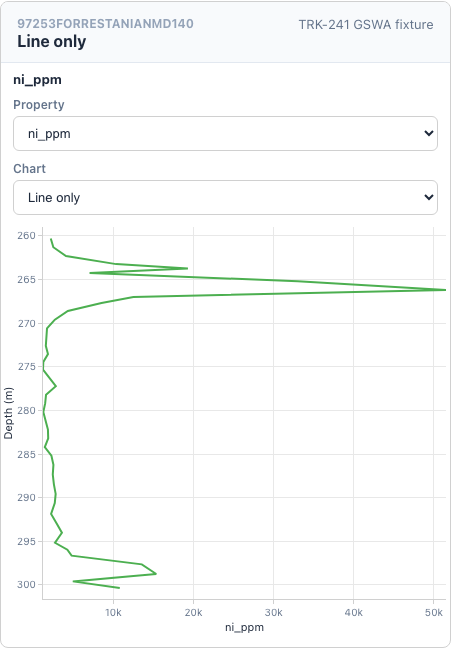
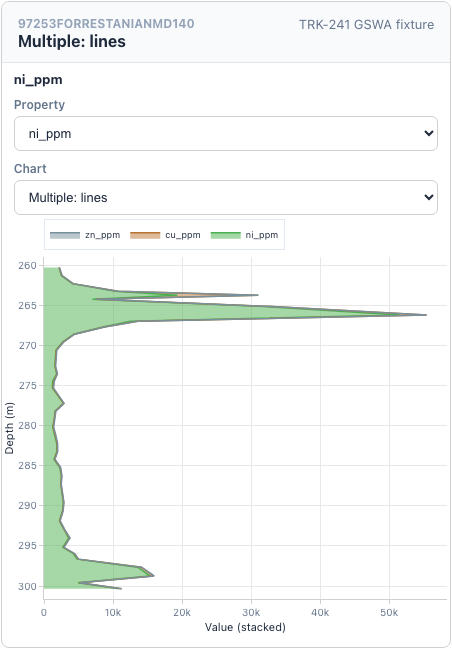
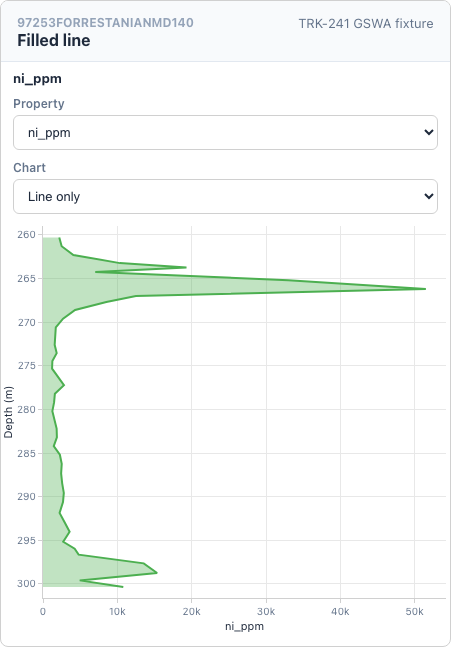
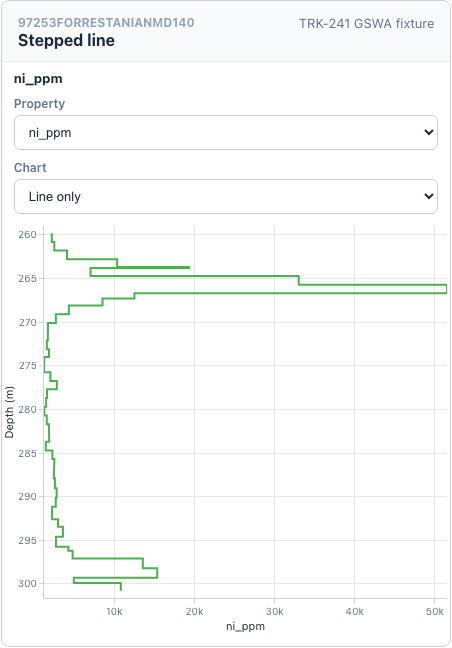
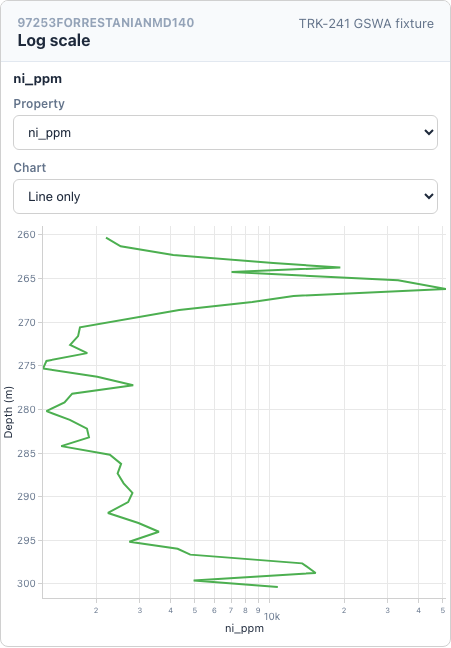
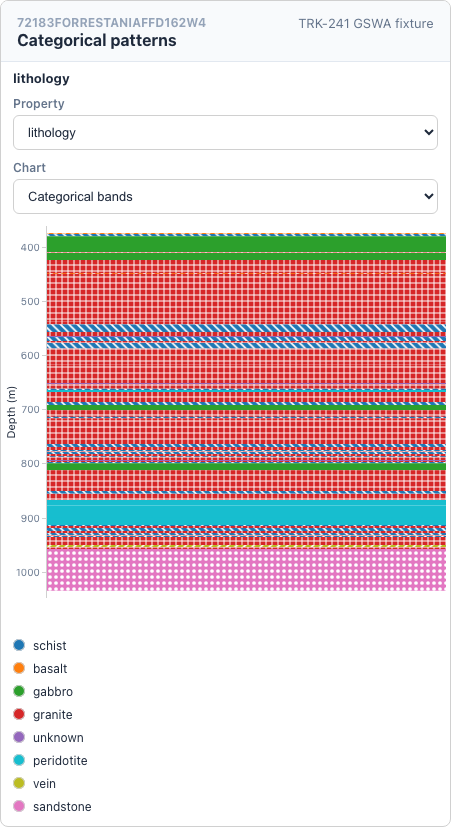
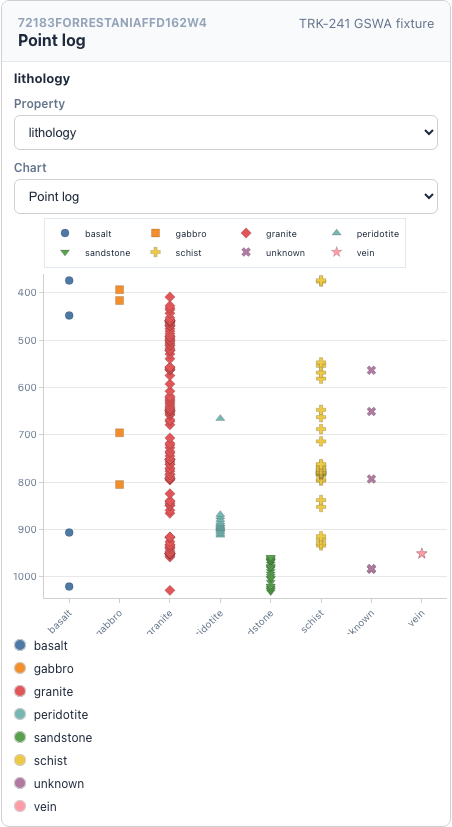
BarsAssay intervals rendered as horizontal bars.MarkersAssay markers with visible interval-extent error bars over a focused depth window.Markers and lineAssay markers and interval extents connected by a line.LineA continuous numeric assay curve.Multiple assay linesSeveral assays rendered together through the standard multi-property control.Multiple stacked assaysSeveral assays shown as stacked interval bars.Heat stripAssay magnitude encoded with a sequential colour ramp.Two-curve fillTwo selected assays with crossover-aware fill.CompositionSelected assays normalized into interval compositions.Graded markers and lineA numeric track coloured continuously by assay value.Filled lineA line track with area fill enabled through wrapper settings.Stepped lineA line track preserving assay interval boundaries.Log scaleA GSWA geophysics channel on a logarithmic value axis.Categorical patternsLithology bands with semantic colours and hatch patterns.Point logCategorical lithology observations represented by symbols.CommentsLogged geology descriptions rendered as interval boxes.Depth annotationsLogged descriptions pinned to interval depths.TadpoleStructural dip heads and azimuth tails.Dip and azimuthSplit structural dip and azimuth tracks.
The command deliberately updates the desktop and mobile baselines, then rebuilds this page from visual-baselines/strip-log-manifest.json. Use npm run test:visual to compare the current render without changing any images.