
Demos
Baselode ships two full-featured demo applications built on the same GSWA drillhole dataset. They are the best way to see every feature working together, and serve as reference implementations for building your own apps.
Sample Datasets
GSWA Geochemistry (test/data/gswa/)
| File | Description |
|---|---|
gswa_sample_collars.csv | Collar locations (lat/lon + easting/northing) |
gswa_sample_surveys.csv | Directional survey measurements |
gswa_sample_assays.csv | Geochemical assay intervals |
gswa_sample_structure.csv | Structural point measurements |
demo_gswa_precomputed_desurveyed.csv | Pre-built 3D traces (UTM Zone 50S) |
Data is derived from the GSWA Geochemistry dataset (CC BY 4.0, Government of Western Australia). See ATTRIBUTION.md for the required attribution statement.
Grade blocks (test/data/grade_blocks/)
| File | Description |
|---|---|
demo_grade_blocks.json | Synthetic polygonal grade block set (schema v1.0) |
React Demo App
Stack: Vite + React + MapLibre GL JS + Plotly + Three.js
The React demo is the primary showcase for the baselode JavaScript library.
Pages
| Route | Description |
|---|---|
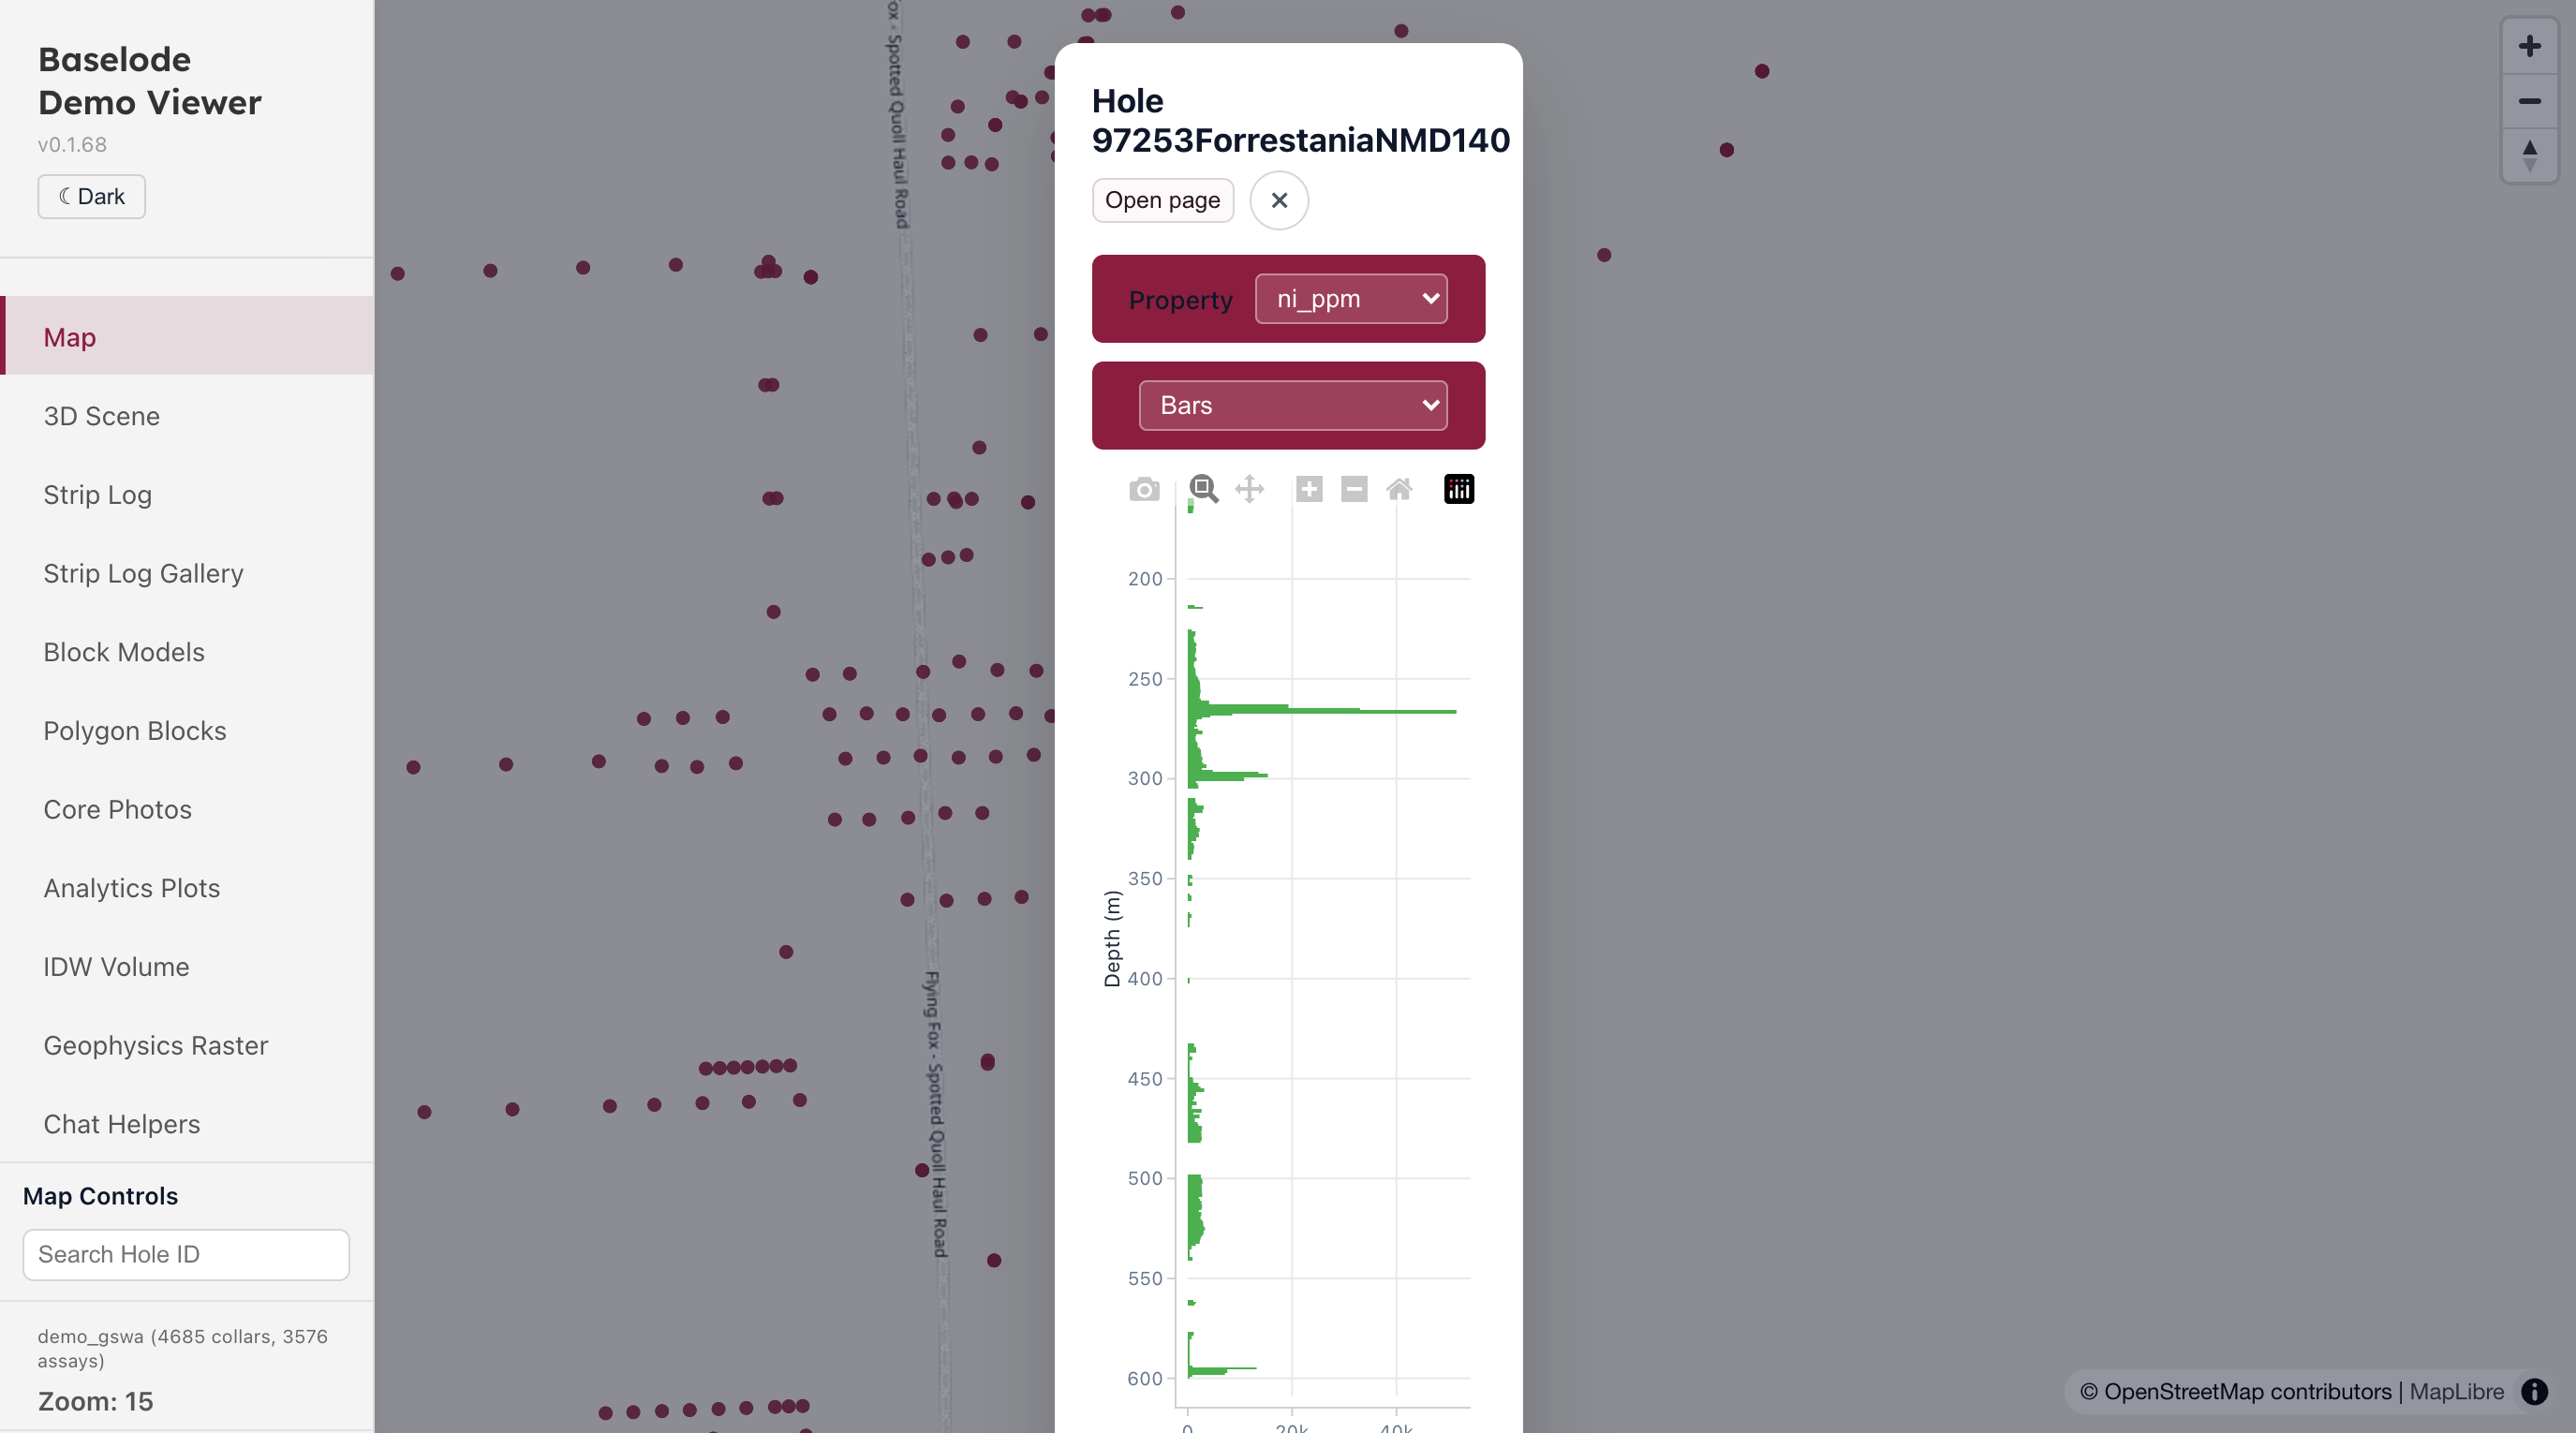
/ | Map — MapLibre map of collar locations. Click a collar to open a strip-log popup with a property selector. Search bar filters visible collars by hole ID. |
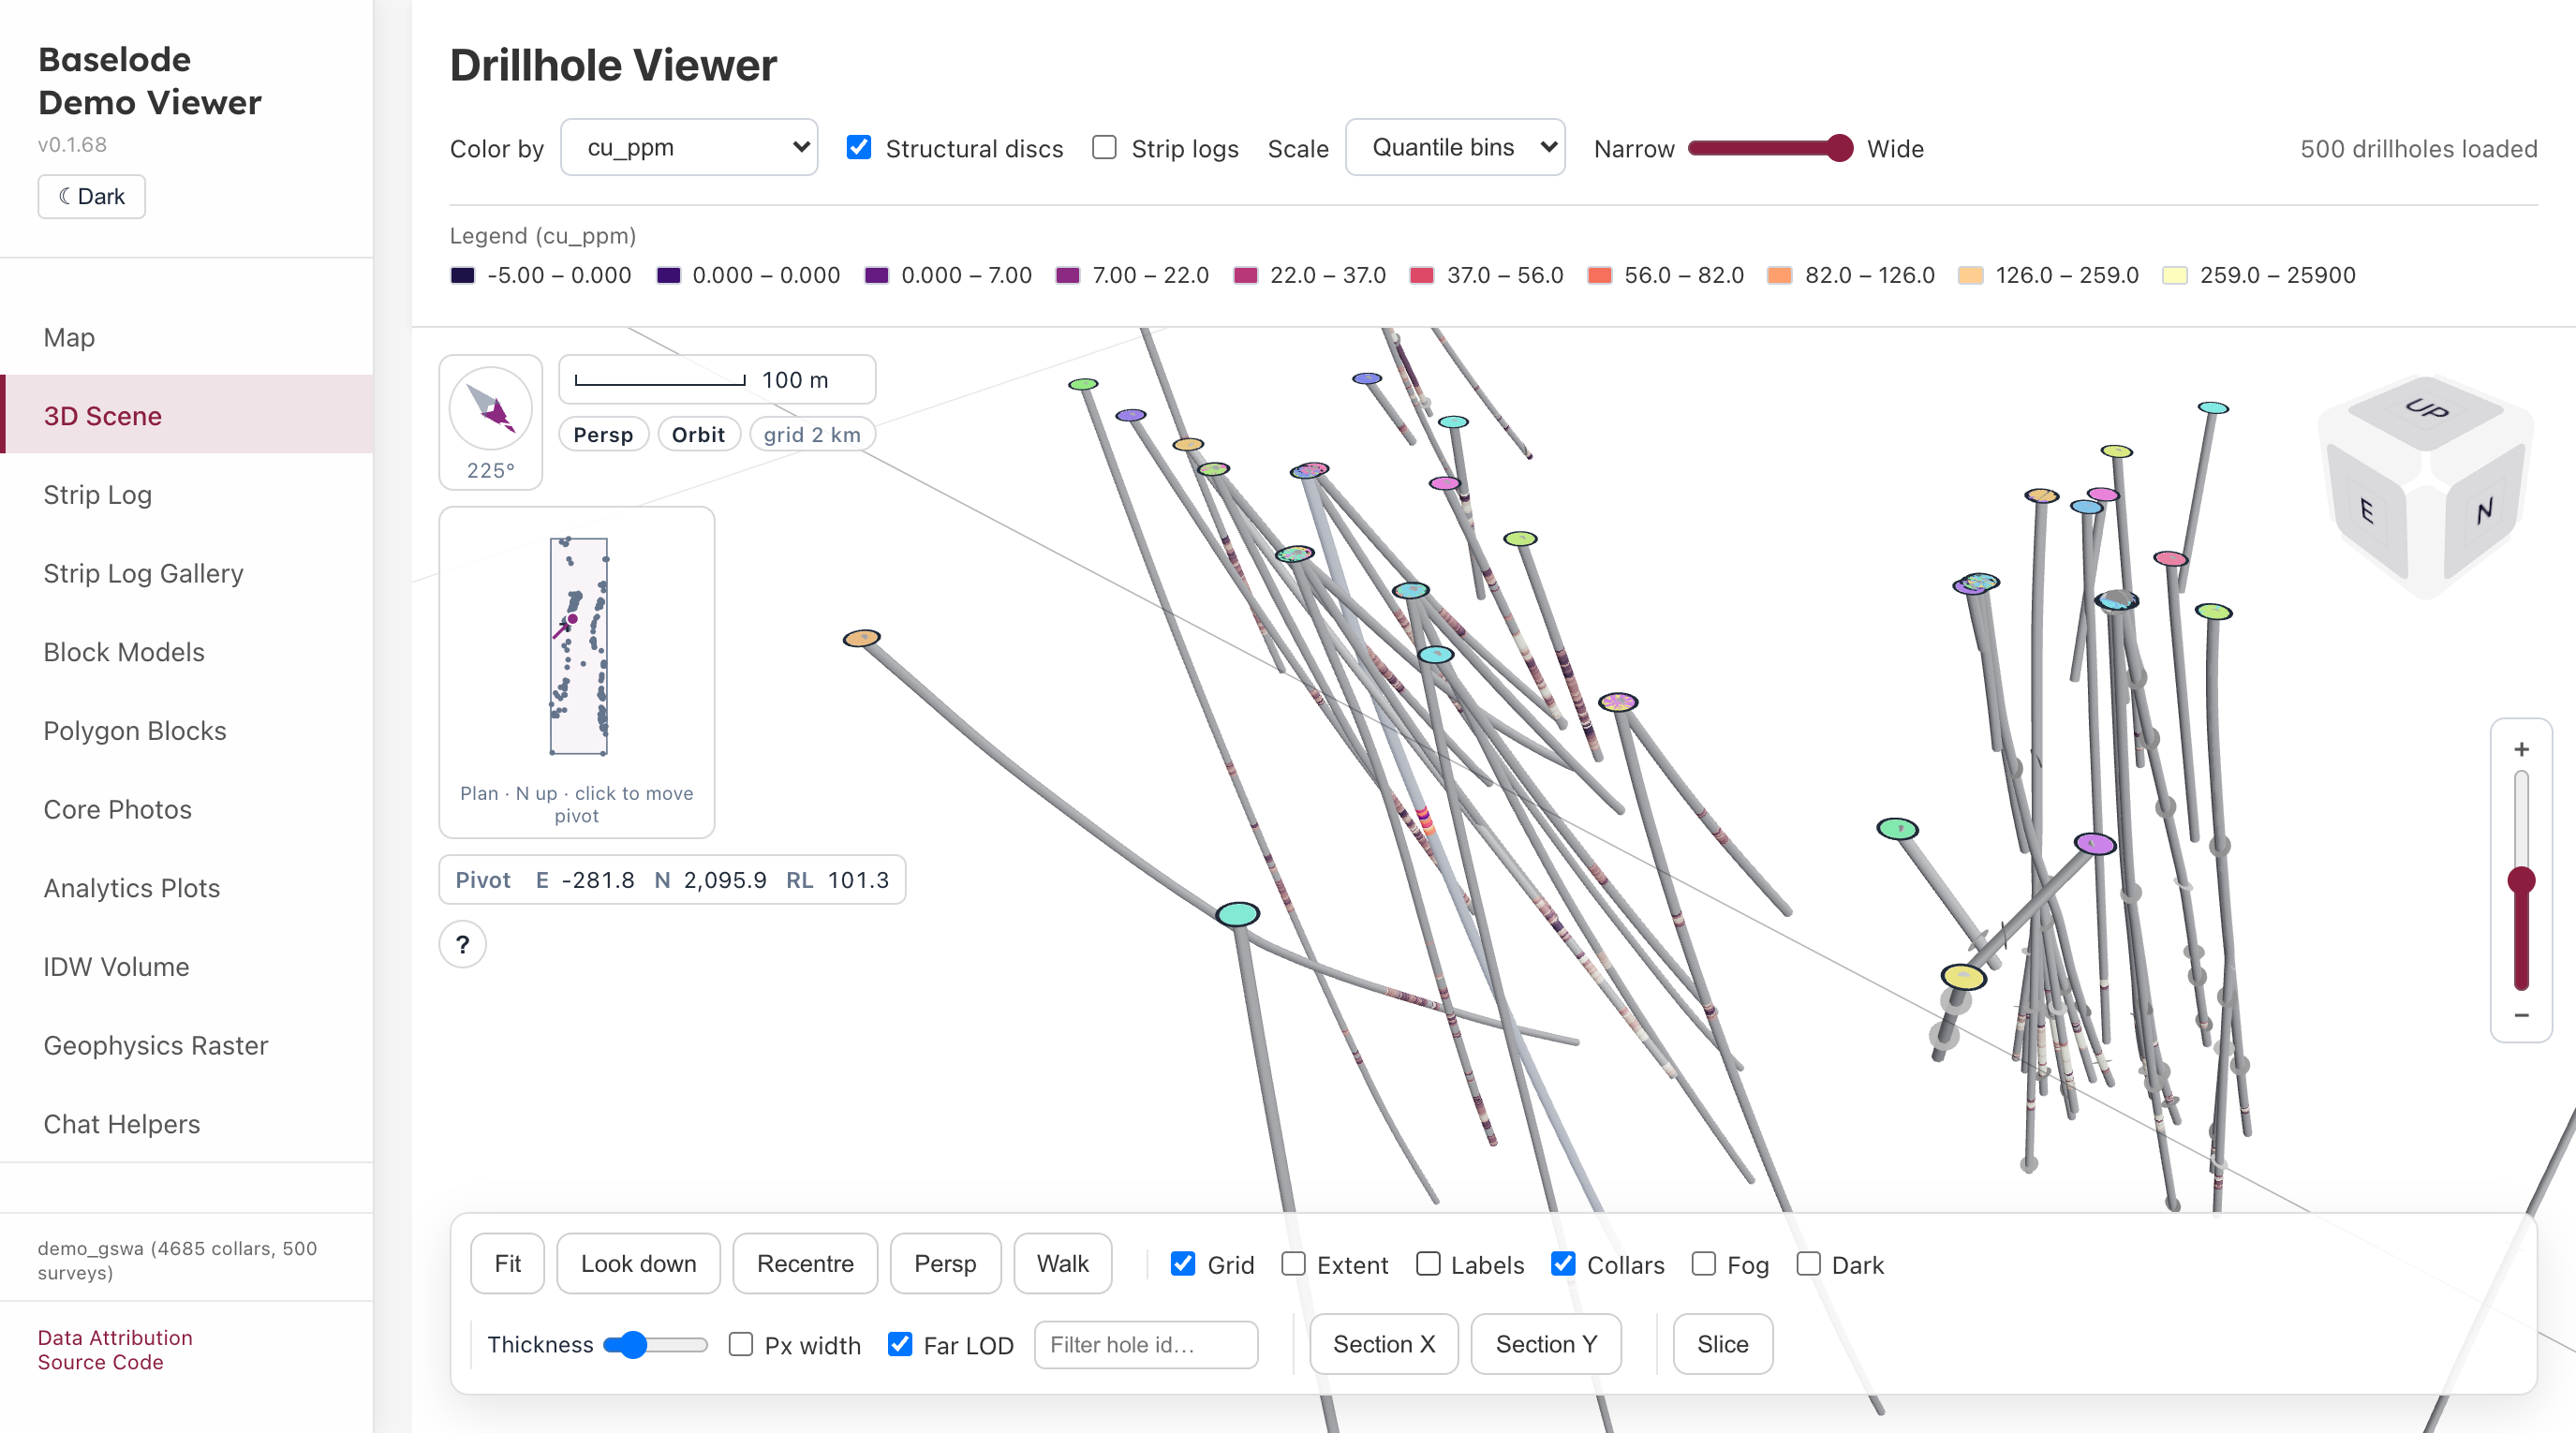
/drillhole | 3D viewer — Three.js scene with desurveyed drillhole traces and structural disc markers. |
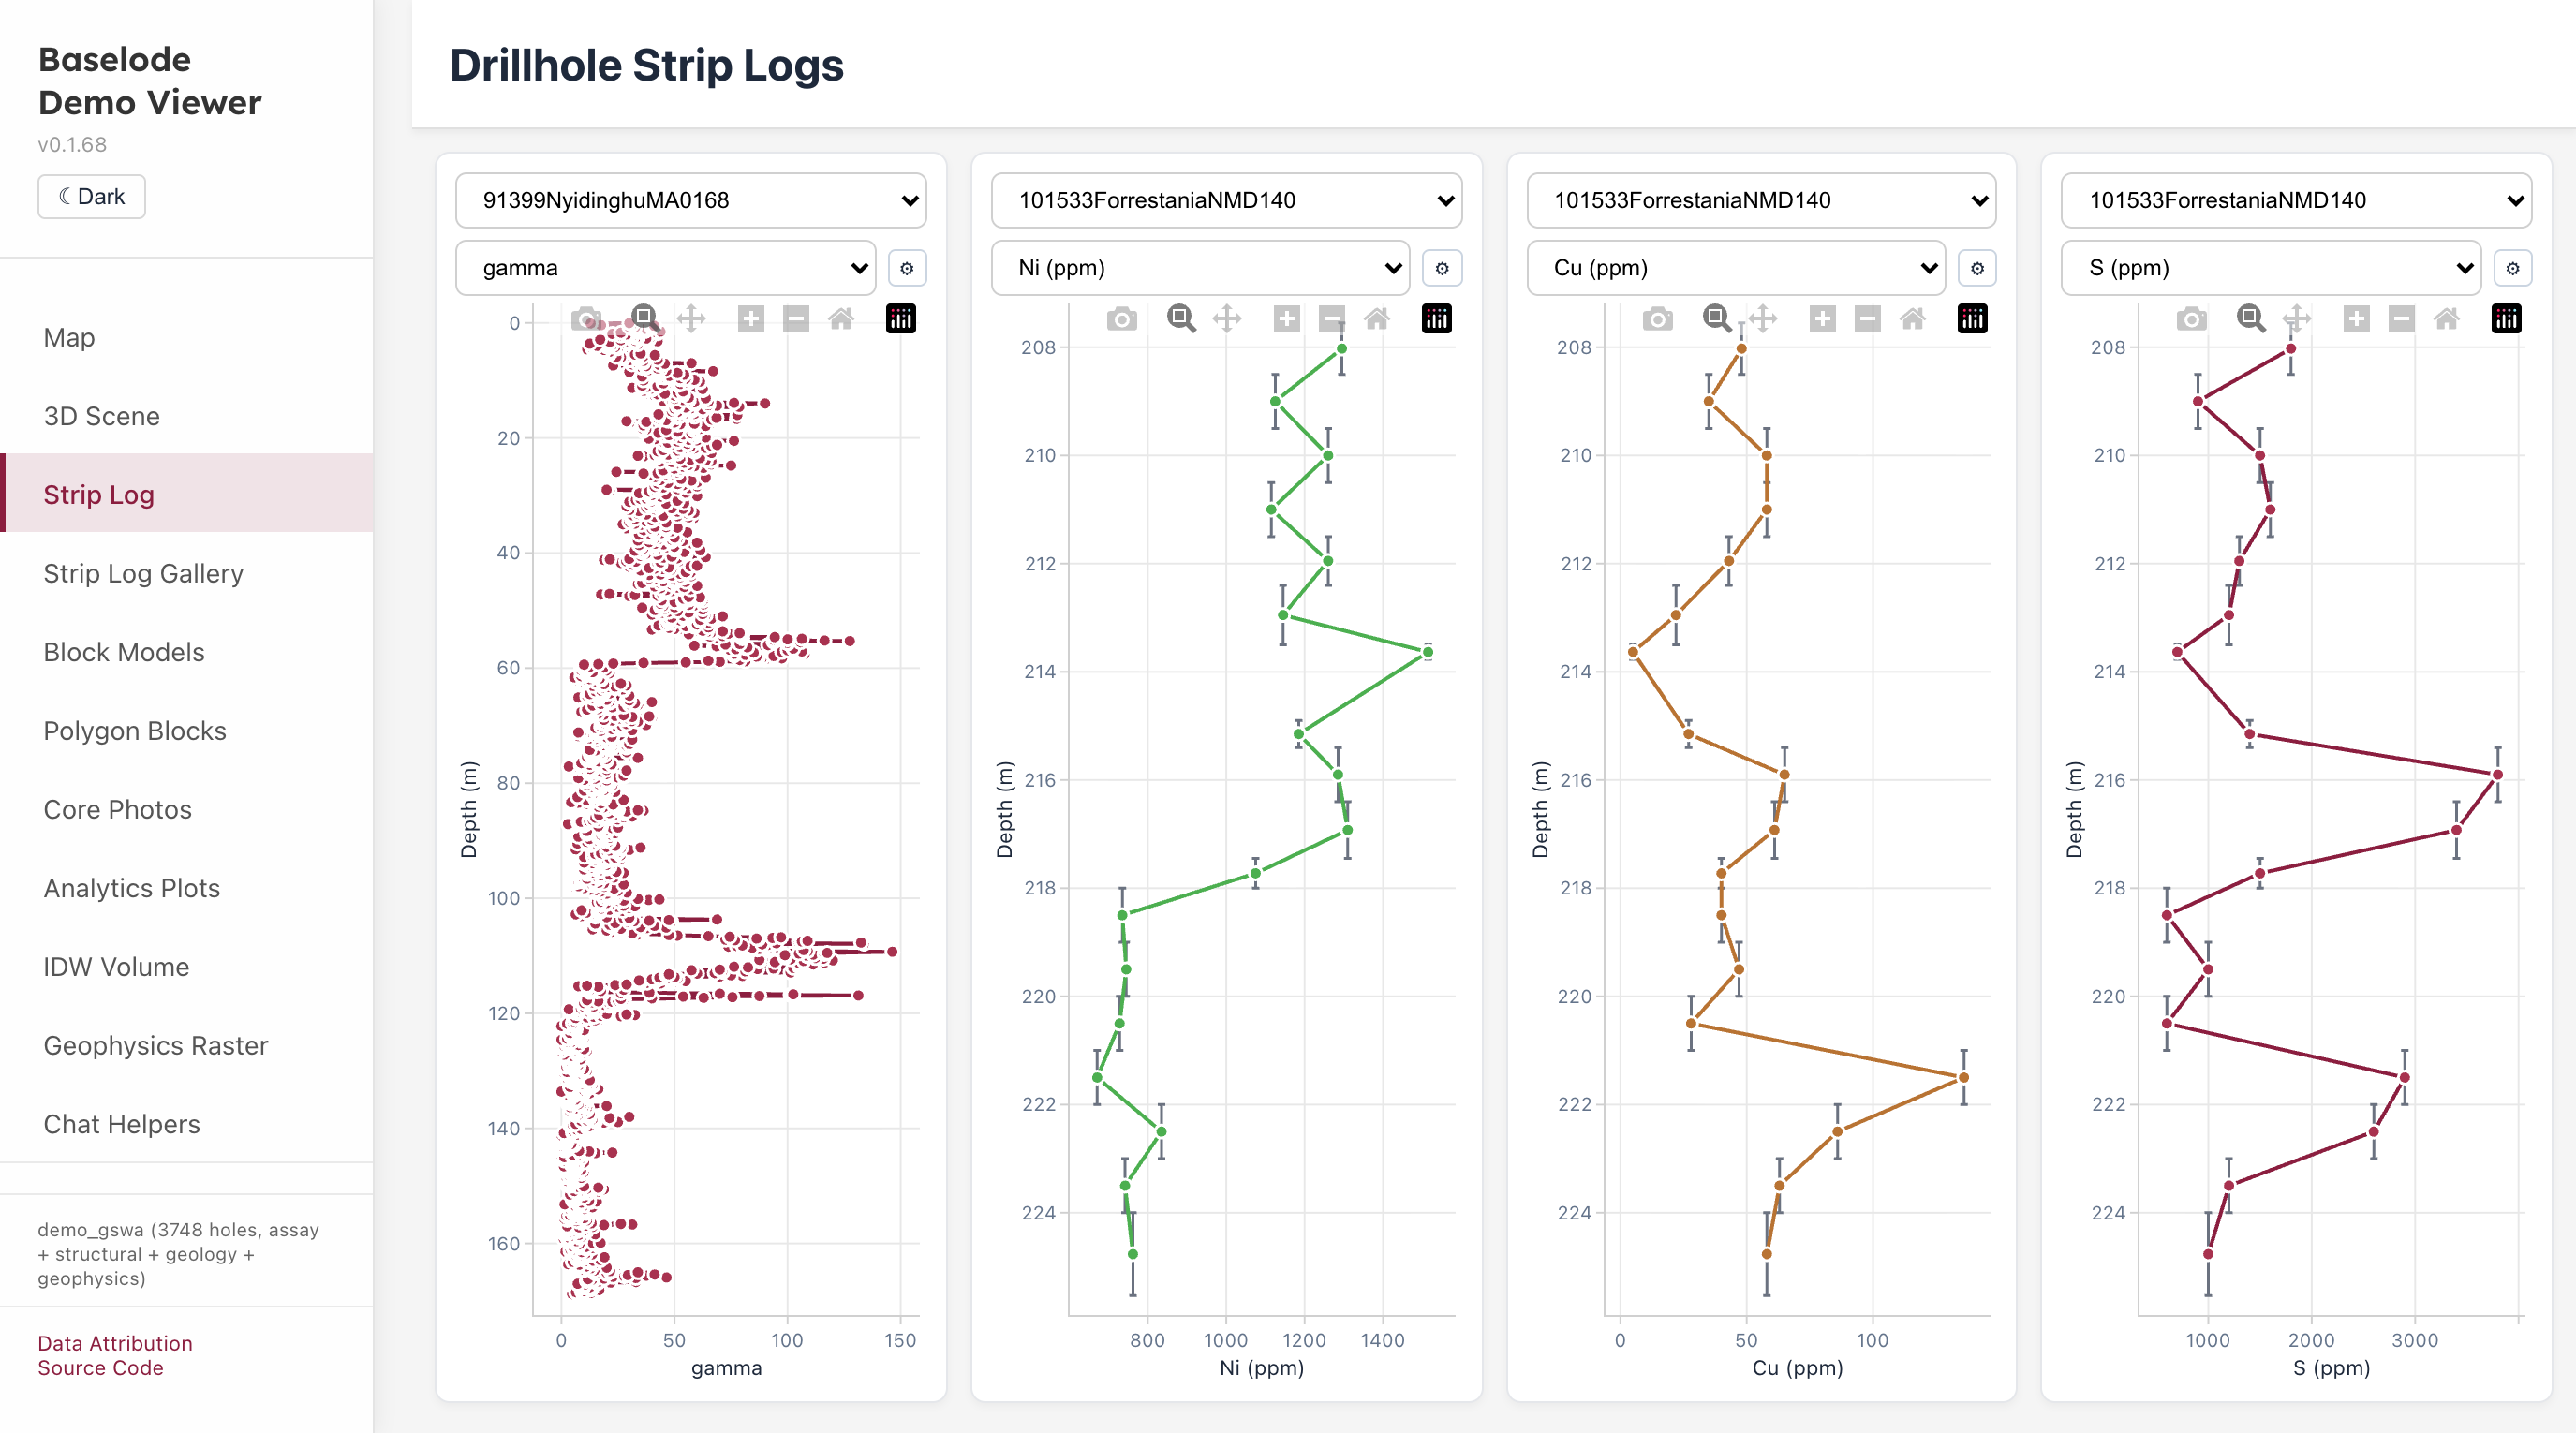
/drillhole-2d | 2D strip logs — Multi-track Plotly strip logs for a selected hole (numeric, categorical, comments, and tadpole tracks). |
/strip-log-gallery | Strip-log gallery — Canonical examples for every supported track type, also used by the visual baseline catalogue. |
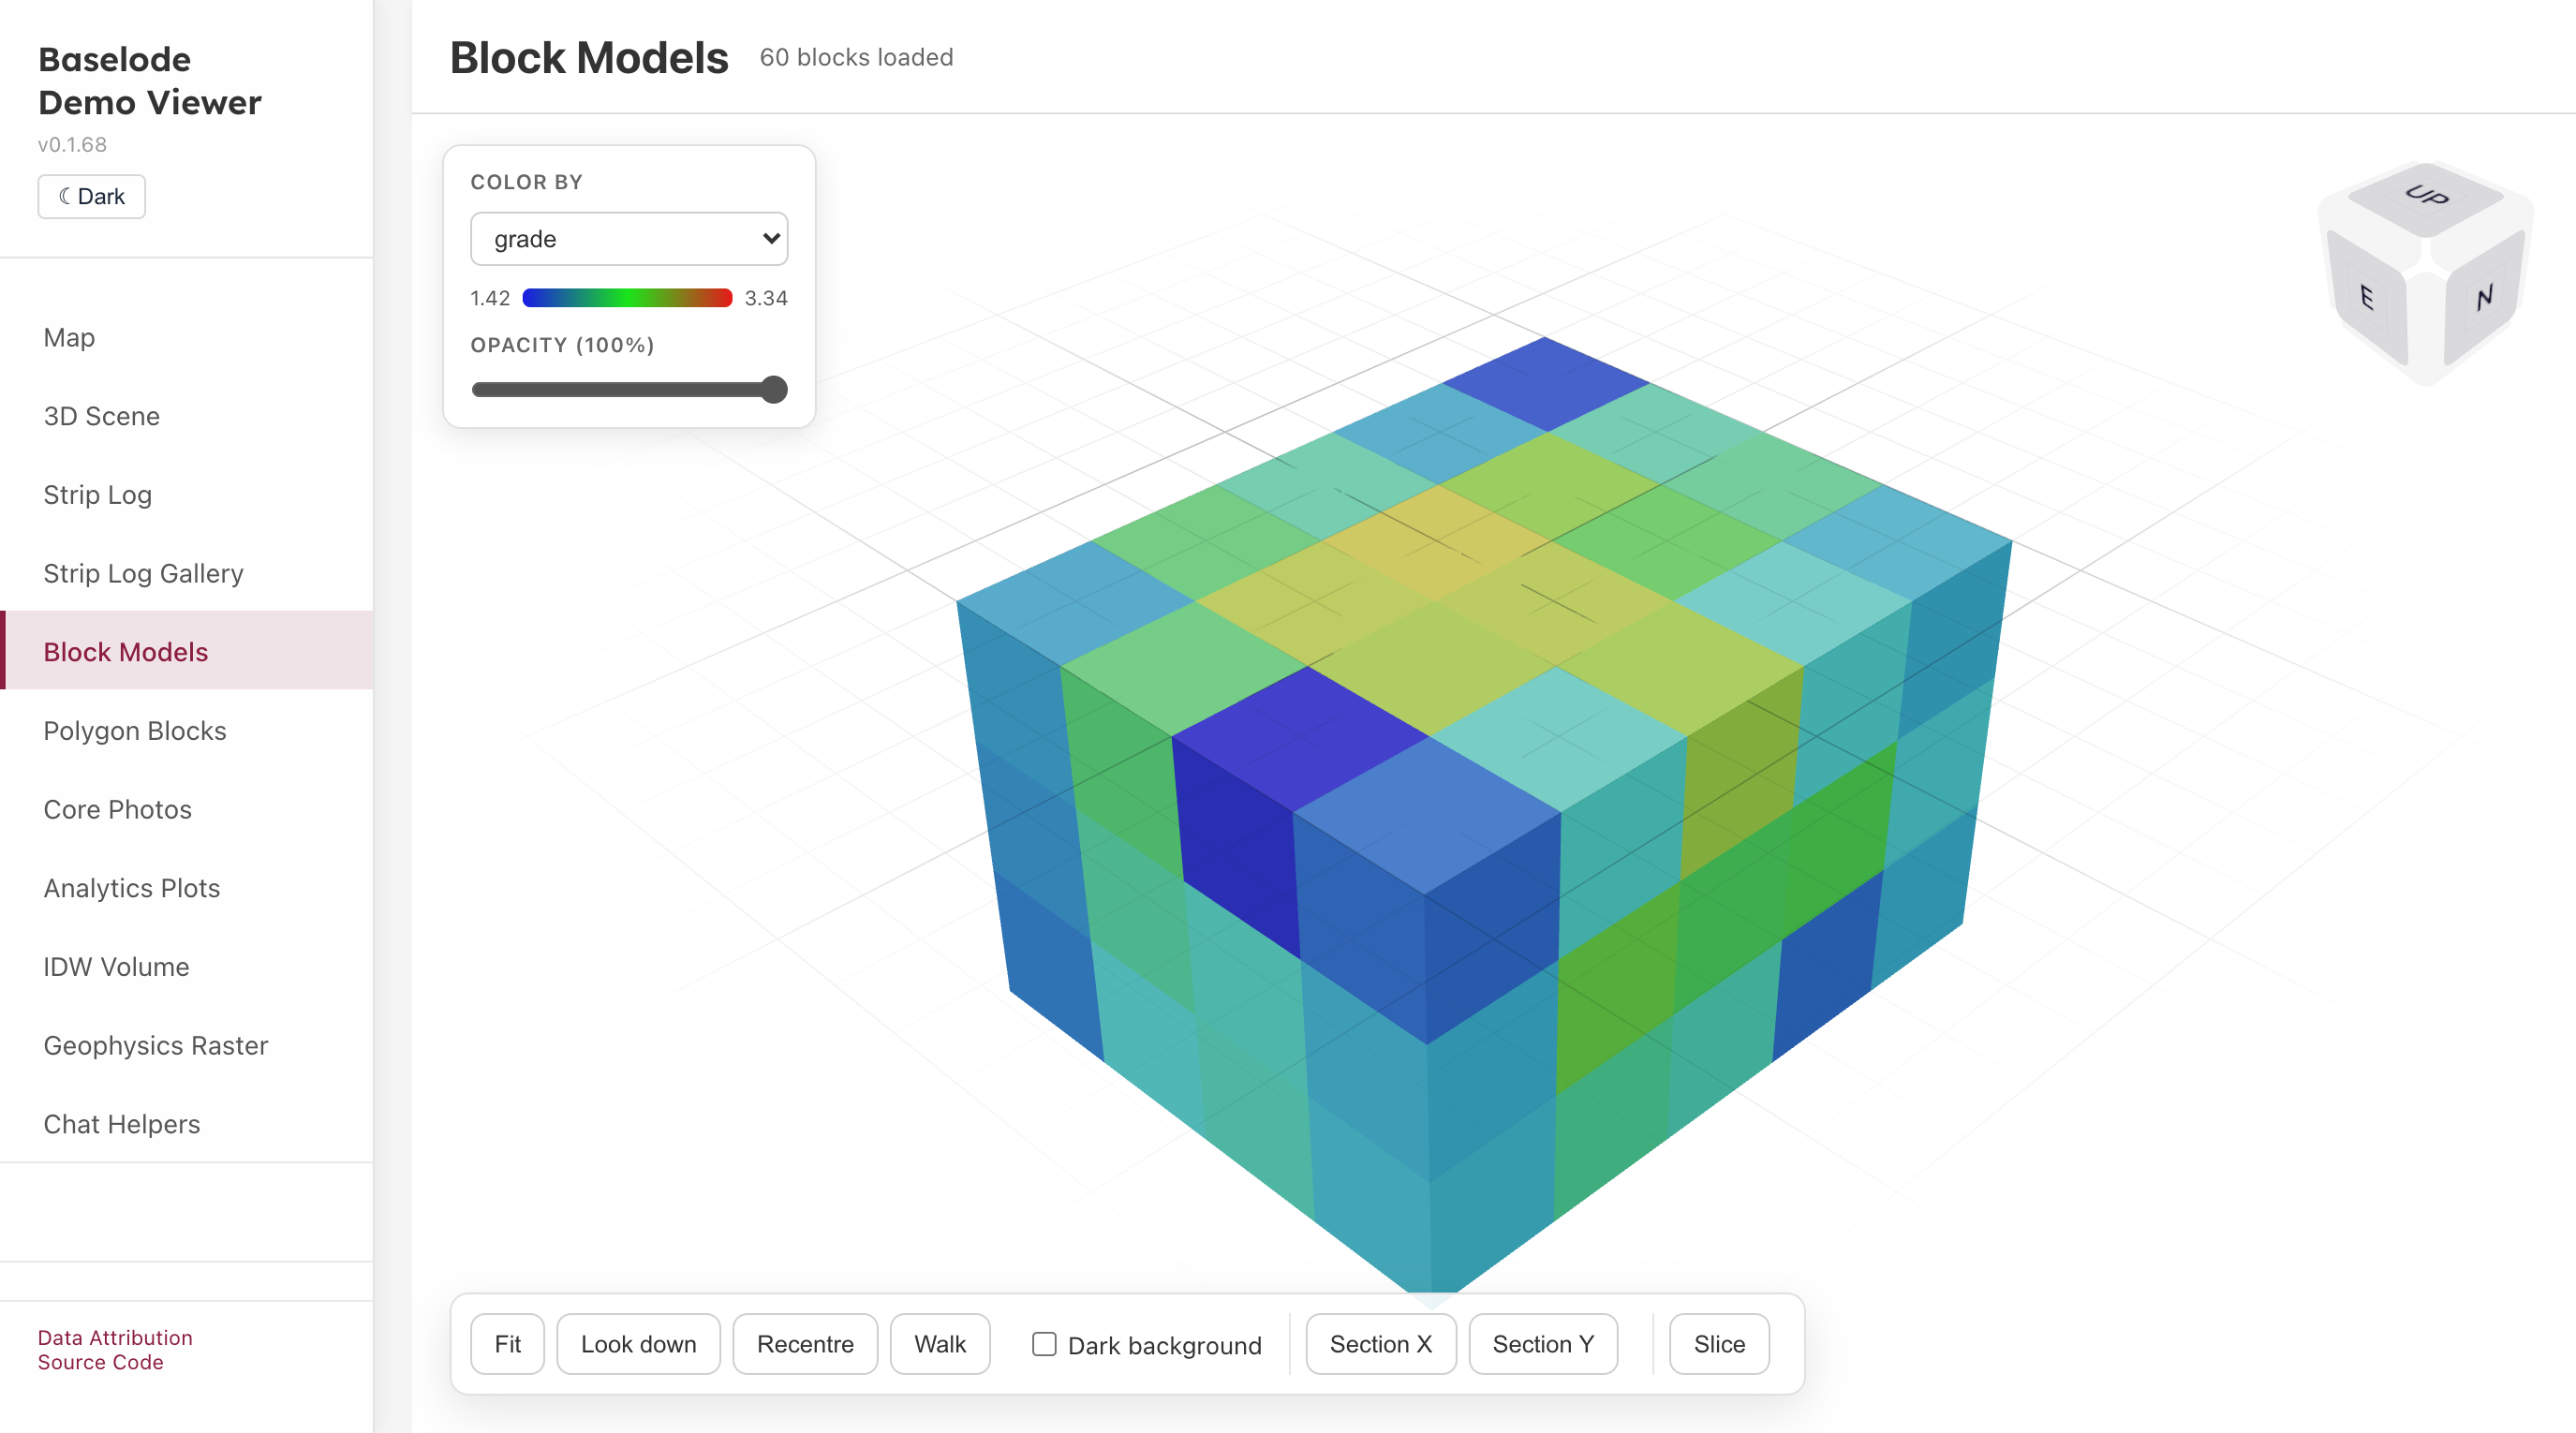
/block-model | Block models — 3D merged-mesh block model viewer with per-property colour mapping and opacity control. |
/polygon-blocks | Polygon Blocks — 3D viewer for polygonal grade blocks loaded from a JSON grade-block set. Click a block to see its attributes; selected block edges are highlighted. |
/core-photo | Core photos: zoomable core-tray photo viewer with linked or independent hole comparison. See the Core Photo Viewer guide. |
/analytics | Analytics plots: scatter, histogram, box, violin and ternary panels over the GSWA assay sample. |
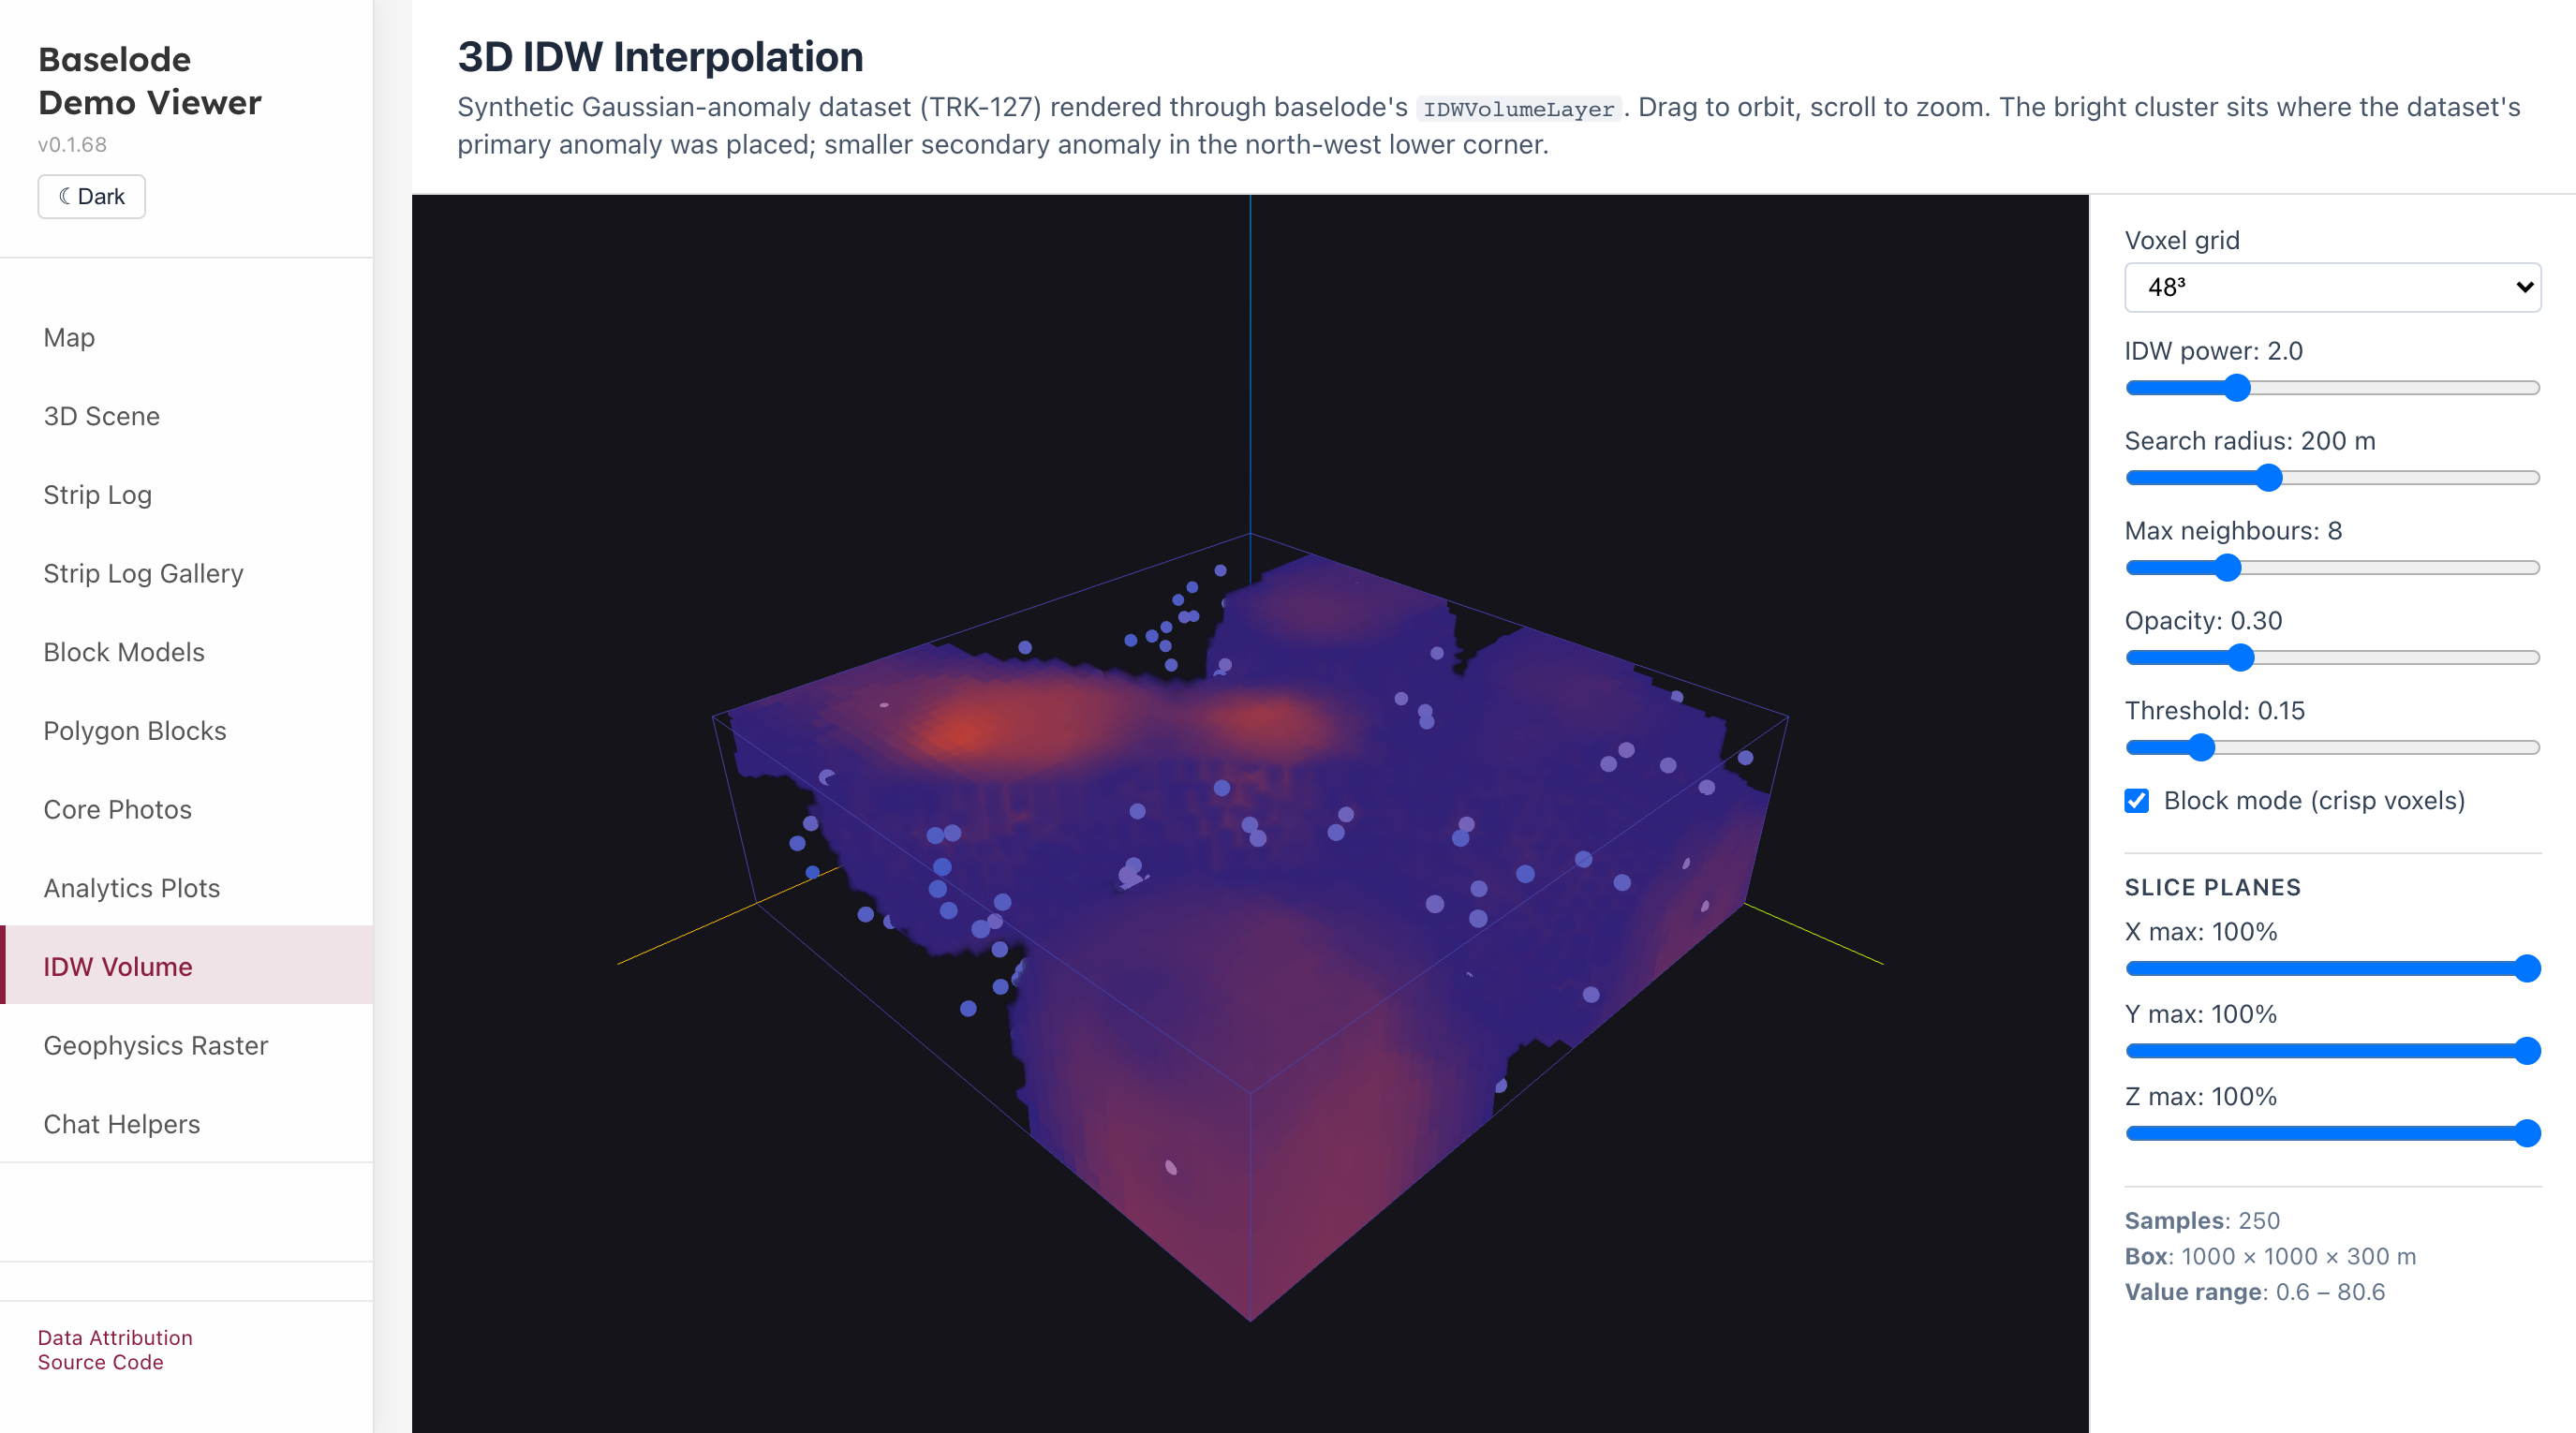
/idw-volume | IDW volume: GPU ray-marched inverse-distance interpolation of a synthetic dataset, with live power, radius, threshold and slice-plane controls. |
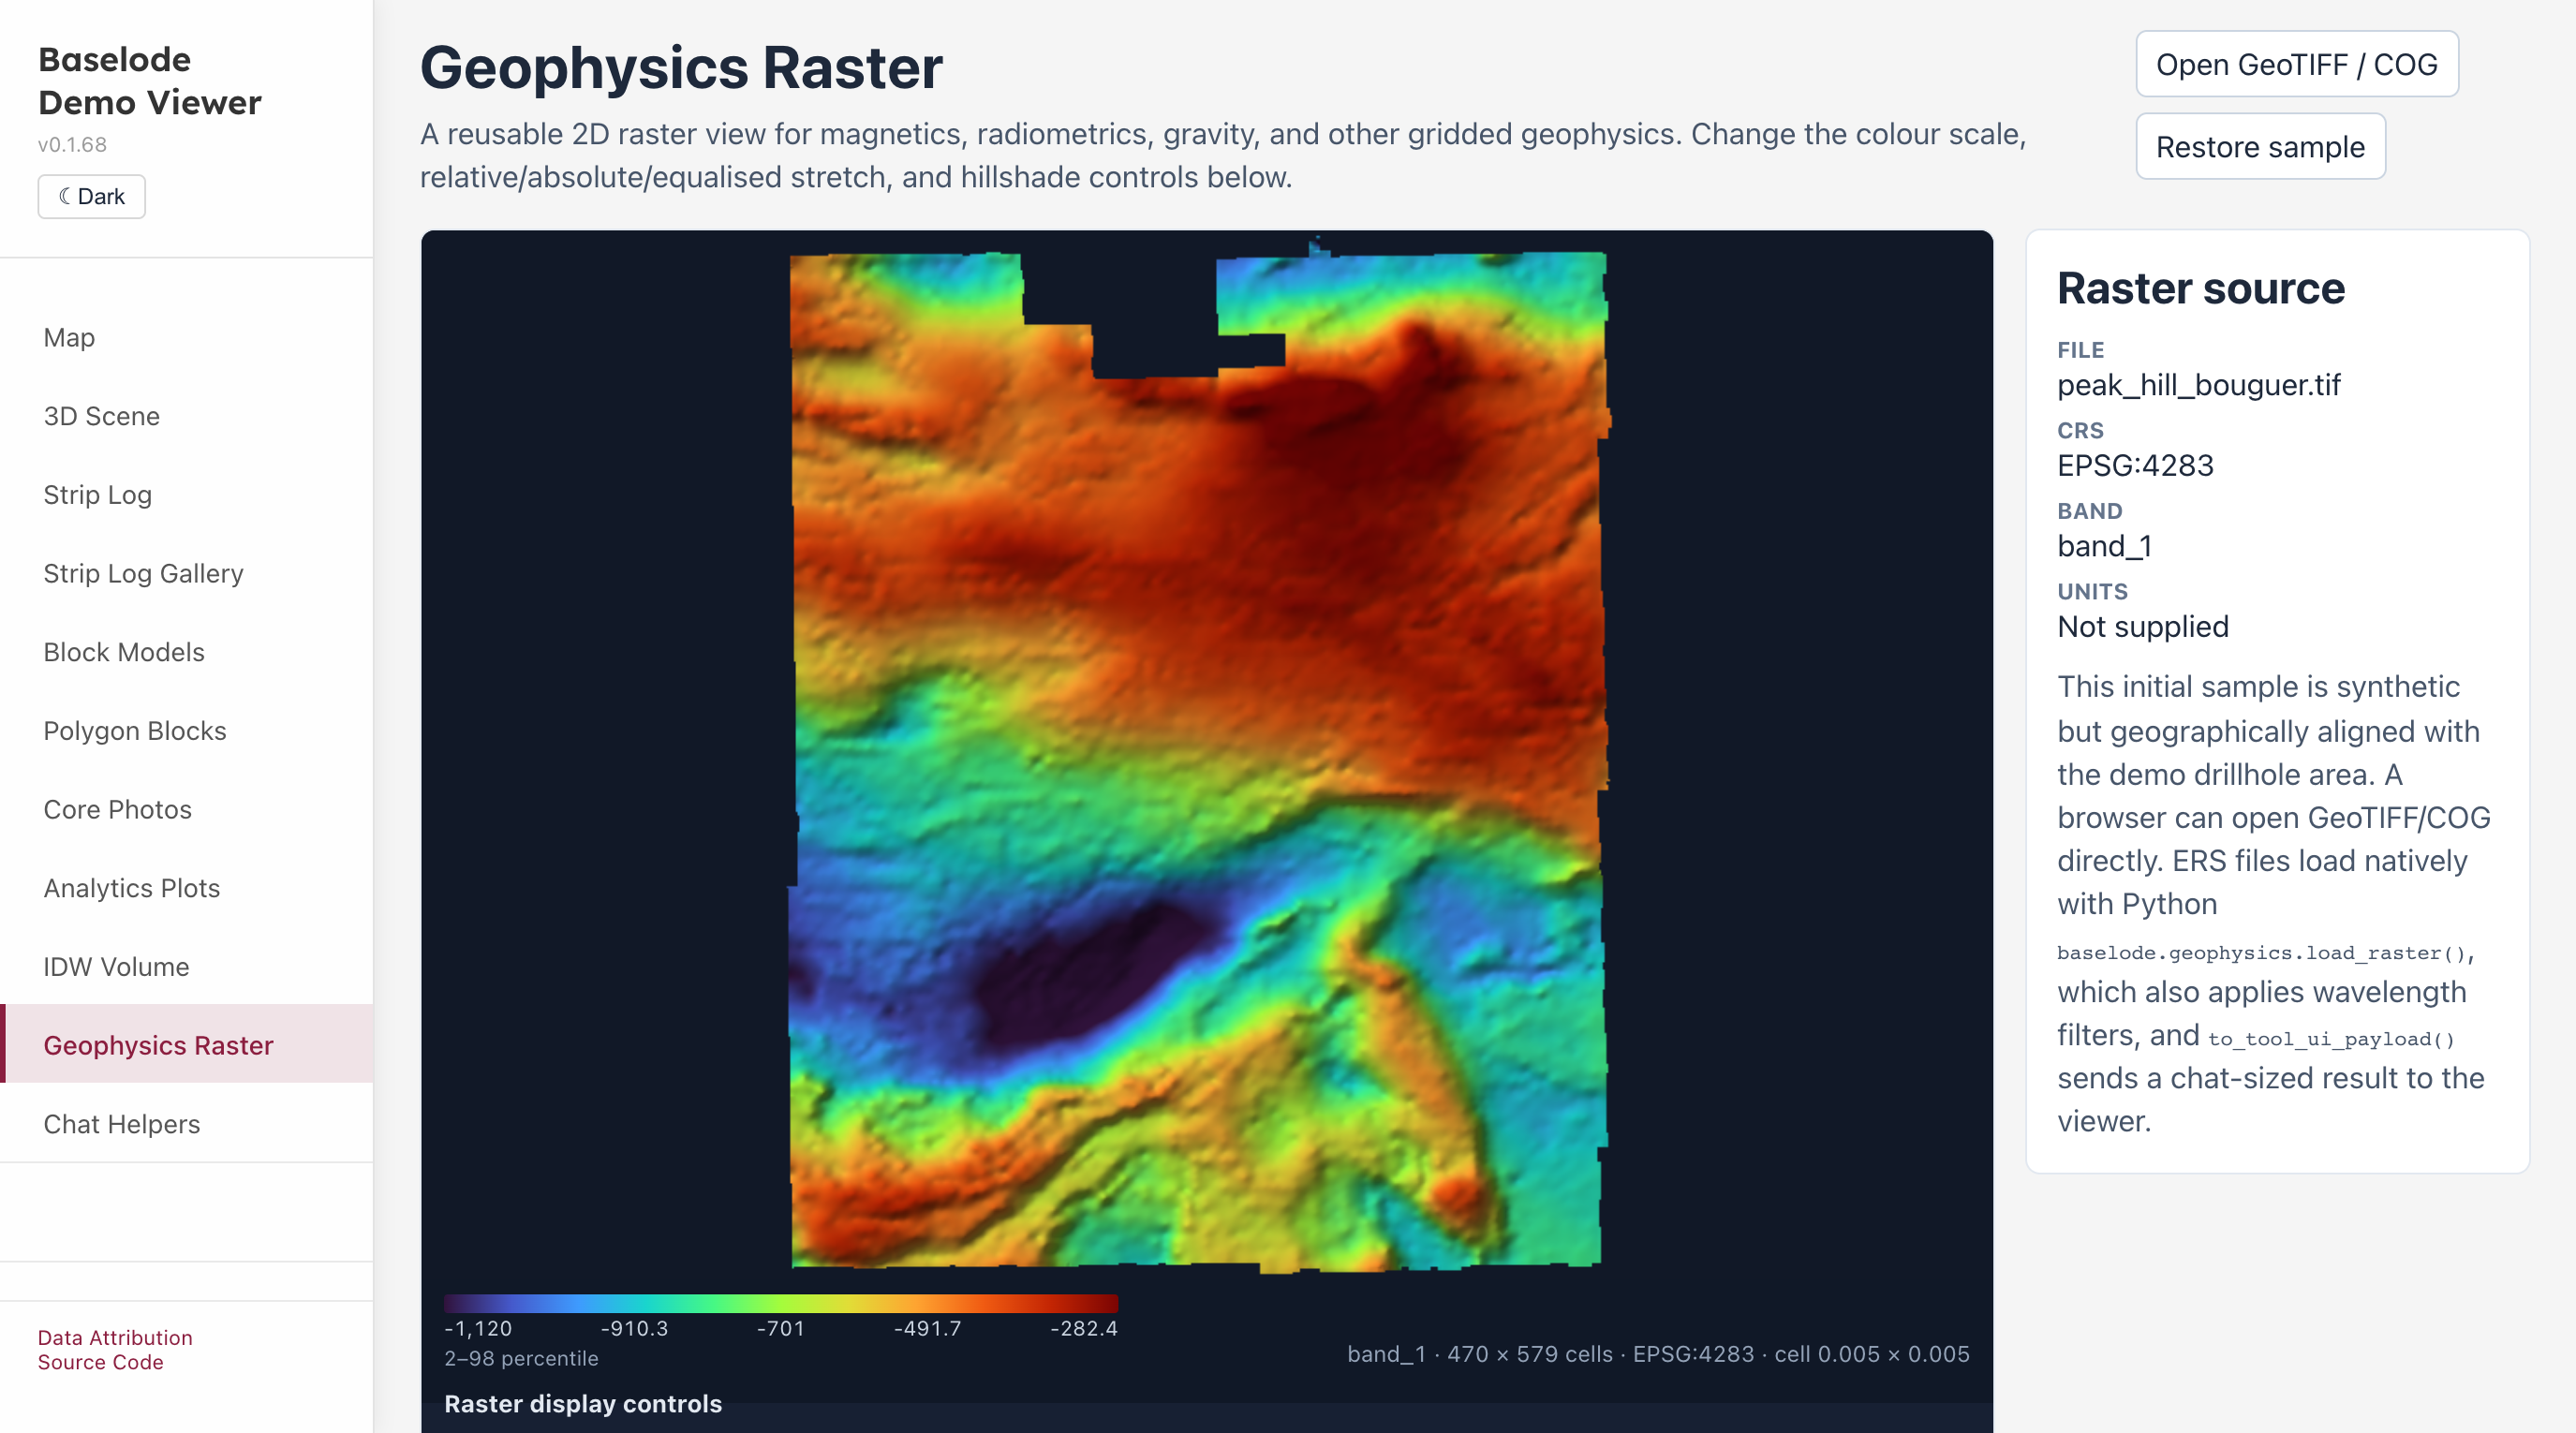
/geophysics-raster | Geophysics raster: GeophysicsRasterViewer with colour scale, stretch and hillshade controls, plus the chat-sized Tool UI preview. Opens a local GeoTIFF or COG. |
/chat-helpers | Chat helpers: a mock assistant conversation rendering each Baselode Tool UI from structured tool results. |
Setup and run
Clone the repository:
bashgit clone https://github.com/darkmine-oss/baselode.git cd baselodeInstall all dependencies (installs both the library and the app):
bashnpm installStart the library watcher and app dev server together:
bashnpm run dev:local --workspace=demo-viewer-react/app # or cd demo-viewer-react/app npm run dev:localOpen
http://localhost:5173in your browser.
The dev:local script runs the library in watch mode (vite build --watch) so changes to the library source are reflected in the app immediately.
Build for production
cd demo-viewer-react/app
npm run build
# Output in demo-viewer-react/app/dist/
Dash Demo App
Stack: Python + Plotly Dash + uvicorn/Starlette + embedded JS 3D viewer
The Dash demo mirrors the React demo and is the primary showcase for the baselode Python library. The map and strip-log pages are rendered entirely in Python with Plotly; the 3D page embeds the JavaScript viewer inside an <iframe>.
Pages
| Route | Description |
|---|---|
/ | Map — Plotly scatter-map of collar locations. Click a collar to open a strip-log popup with a property selector. |
/drillhole | 3D viewer — Embedded JS baselode viewer rendered inside an iframe. |
/drillhole-2d | Strip logs — Multi-track Plotly strip logs for a selected hole. |
Setup and run
Option A — pip / venv
# from repo root
python -m venv .venv
source .venv/bin/activate      # Windows: .venv\Scripts\activate

pip install -r demo-viewer-dash/requirements.txt
pip install -e python/src

cd demo-viewer-dash
uvicorn asgi:app --host 127.0.0.1 --port 8050 --reload
Option B — Conda
# Assumes conda is installed
conda env create -f environment.yml
conda activate env-baselode

cd demo-viewer-dash
uvicorn asgi:app --host 127.0.0.1 --port 8050 --reload
Open http://127.0.0.1:8050 in your browser.
The --reload flag watches for source changes and restarts the server automatically.
Jupyter Notebooks
Example Jupyter notebooks live in the notebooks/ directory.
| Notebook | Description |
|---|---|
example_drill_tour.ipynb | End-to-end tour: loaders, map, strip logs, desurvey, compositing, interval algebra, validation, DrillholeSet, OMF export |
example_drillhole_set.ipynb | DrillholeSet composition root focused walkthrough |
example_omf_export.ipynb | GSWA → OMF round-trip focused walkthrough |
example_darkmine_vault_api.ipynb | Pull drillhole data from the Darkmine Vault API |
Running notebooks
# from repo root (with venv or conda env active)
pip install baselode jupyter

jupyter notebook notebooks/
Regenerating Precomputed Desurvey
The demo_gswa_precomputed_desurveyed.csv file is built by the React demo's Node.js script and is committed for convenience. To regenerate it:
cd demo-viewer-react/app
node scripts/generate_precomputed_desurvey.mjs
This writes the file to test/data/gswa/demo_gswa_precomputed_desurveyed.csv.